Tips for Using Your New Google Analytics GA4
Google Analytics Armageddon is Almost Here!
We hope you’ve invested some time into figuring out how the new GA4 works and how it differs from the old UA. In case not, here are some tips to start it off.
Our clients:
All our active clients for Google Ads Management with inclusive packages in Analytics or Looker Studio Reporting are on the new GA4 already.
Since “Google Analytics D-Day” has almost come, we thought maybe it was a good time to share a few tips about GA4, especially for those people who have delayed switching over to using the new version thanks to the obvious learning curve involved. Or just because you couldn’t let go of a familiar friend.
Not sure what date we’re talking about?
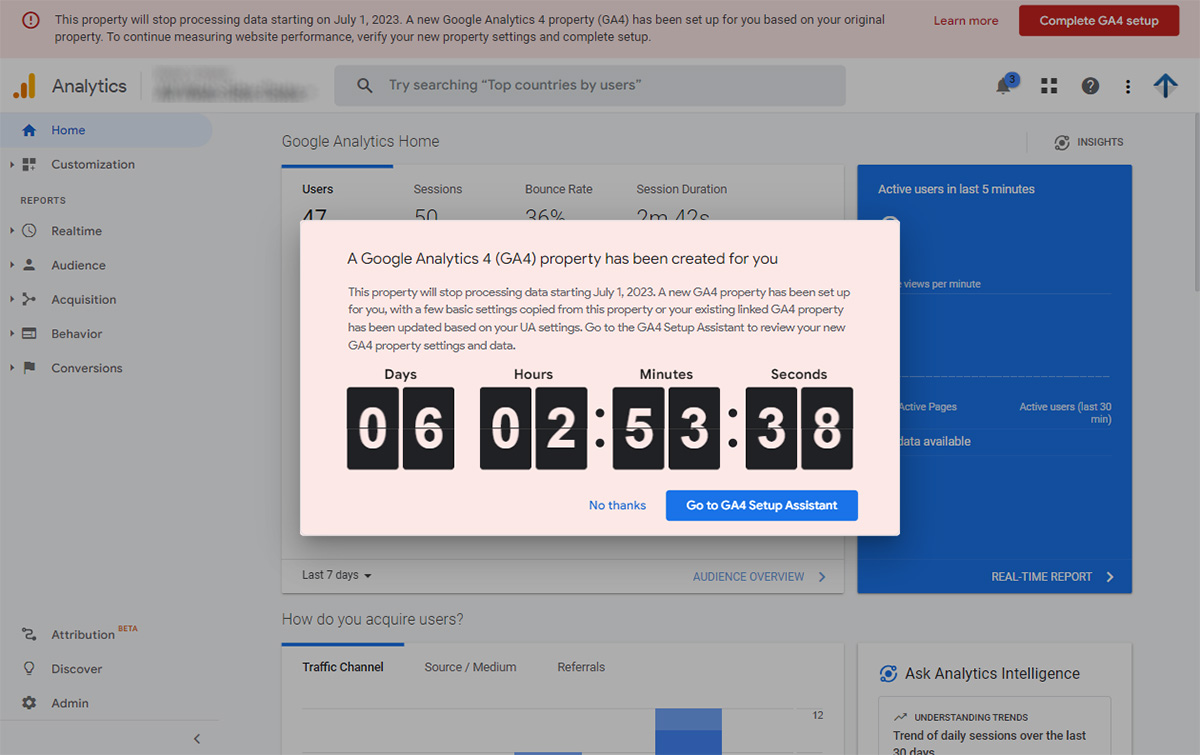
On July 1, 2023, the old Google Analytics (Universal Analytics) will stop working entirely. You’ll still have access to the data, for now, but from this date no new data will be added to it, even if you keep the Google Analytics UA code installed in your website.
Google have been sending out increasingly alarming message to lots of you warning how you must switch over ASAP. They have even put in an “emergency plan” of sorts in case you still didn’t do it.
Universal Analytics has been with us many years now. Since 2012. So, over the 11 years since then perhaps you’ve come to love it, or like so many, you loath it. Whichever way you feel about the old version, it was a powerful tool capable of telling you a lot about users and their behaviour on your website and we’ve always been strong promoters of its use.
Well, since 2020, the new Google Analytics version GA4 has been edging its way into the limelight. First as a ‘beta’, but now from July 1st 2023, it will become your only choice.
Historical data:
You can’t import your historical data from Google Analytics Universal Analytics into the new GA4. If there is data you want to keep out of that platform, then you have until July 1st, 2024, to download what you want from it.
If you prefer to get some great looking reports out of the old GA-UA and still be able to use them in the future, talk to RankPower to discuss a Data Preservation project.
If you decide to do nothing, then after July 1st, 2024, all that data will be permanently erased by Google, so make sure you act sooner than later as we are not likely to be able to help lots of businesses at the last minute.
Realtime:
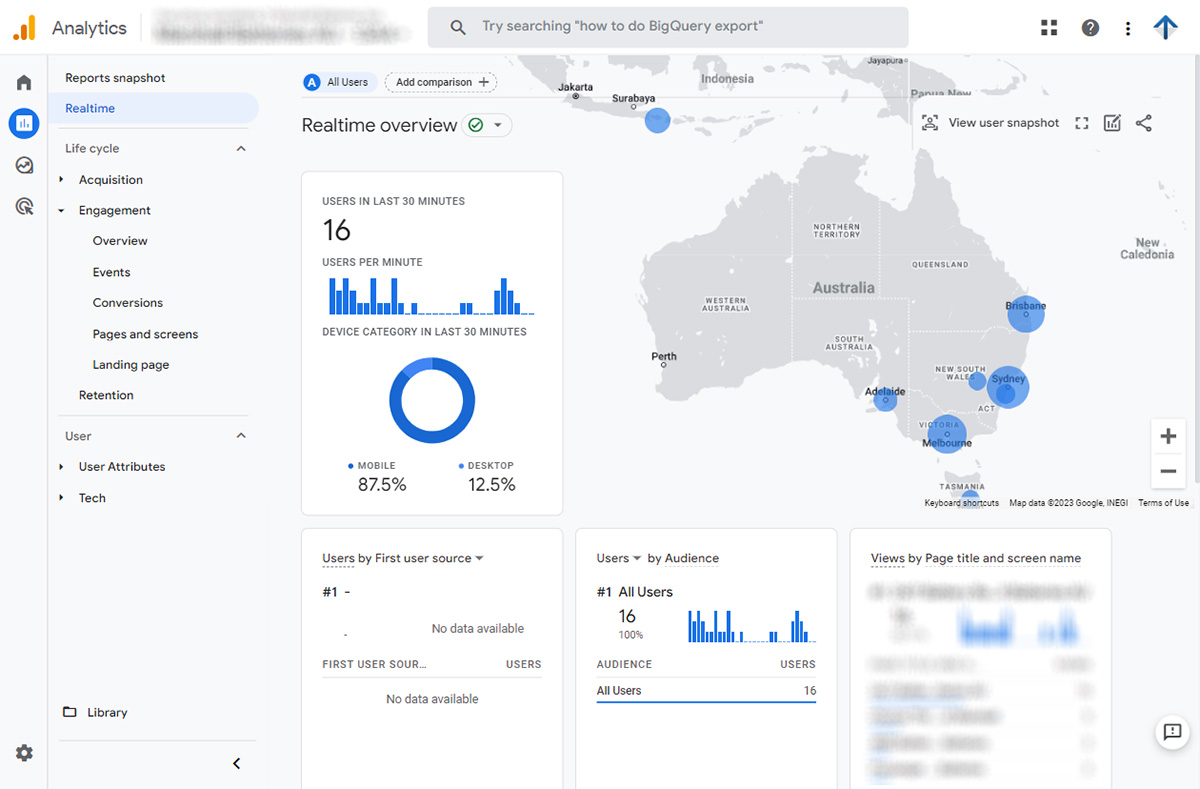
In the Realtime report, you can see what is happening now on your website. If you already have GA4 installed, try navigating (clicking) a few pages in your own site and you’re likely to see your own hits recorded there, but be aware:
- There is a slightly longer delay seeing actual real-time hits displayed compared with the old GA, meaning, if you are a wee bit impatient you might panic if you navigate a few pages on your site yourself and don’t instantly see that data in the Realtime report. It’s significantly slower to show there than the old Analytics but give it a minute and it will show up if everything is working.
- Once activity falls off the Realtime reports 30 min later, it doesn’t show up in the main reporting for anything from 12-24 hours later again. Very much unlike the old Analytics, which showed data in main reporting almost immediately. We think that one reason for this might be to ensure that real-time hits have time to blend with more data from other users, thereby keeping one specific user’s activity private. GA4 is designed to be a more privacy-centric platform
Here’s a guide to Data Freshness in GA4 and which relates to what I have noted above.
Events:
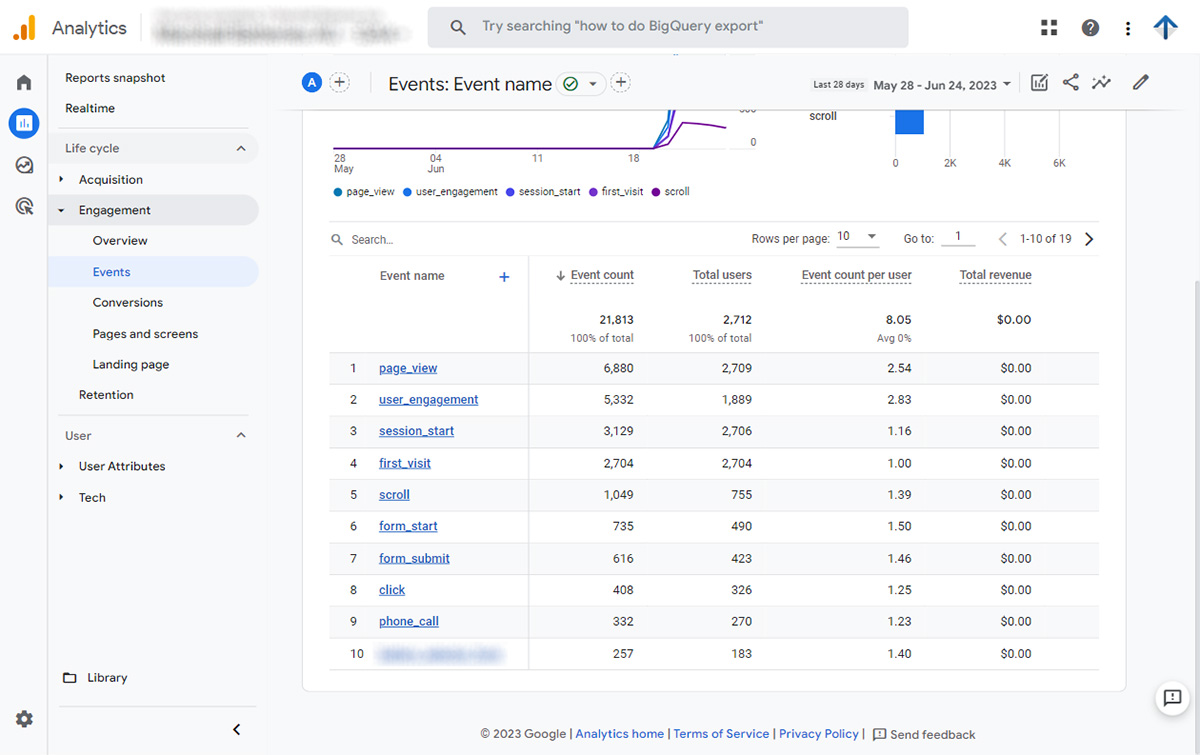
One of the most useful reporting pages in the Events report in the Life Cycle > Engagement section.
That’s because it shows a list of “all the things that happened” on the site, now all known as “events”. Every view of a page (“page_view”) is now also in this group of events and is just one of those many things that happened. This differs to how you may be used to seeing pageviews in the old Analytics.
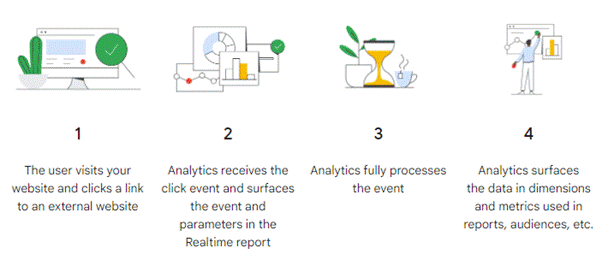
Some help to better understand what GA4 Events are.
Bounce Rate:
It’s no longer a regular metric surfaced in these reports. We’ve always hated it as a metric anyway because lots of people have used it as a measure of performance, which we have always felt was wrong. Perhaps the fact that it’s not there as a standard metric now is like Google agreeing with us. Instead, what you have is “engagement”, which a measure of which how many people are staying and doing things. A more positive view of activity?
This is just one example of different perspective.
Details, details, details:
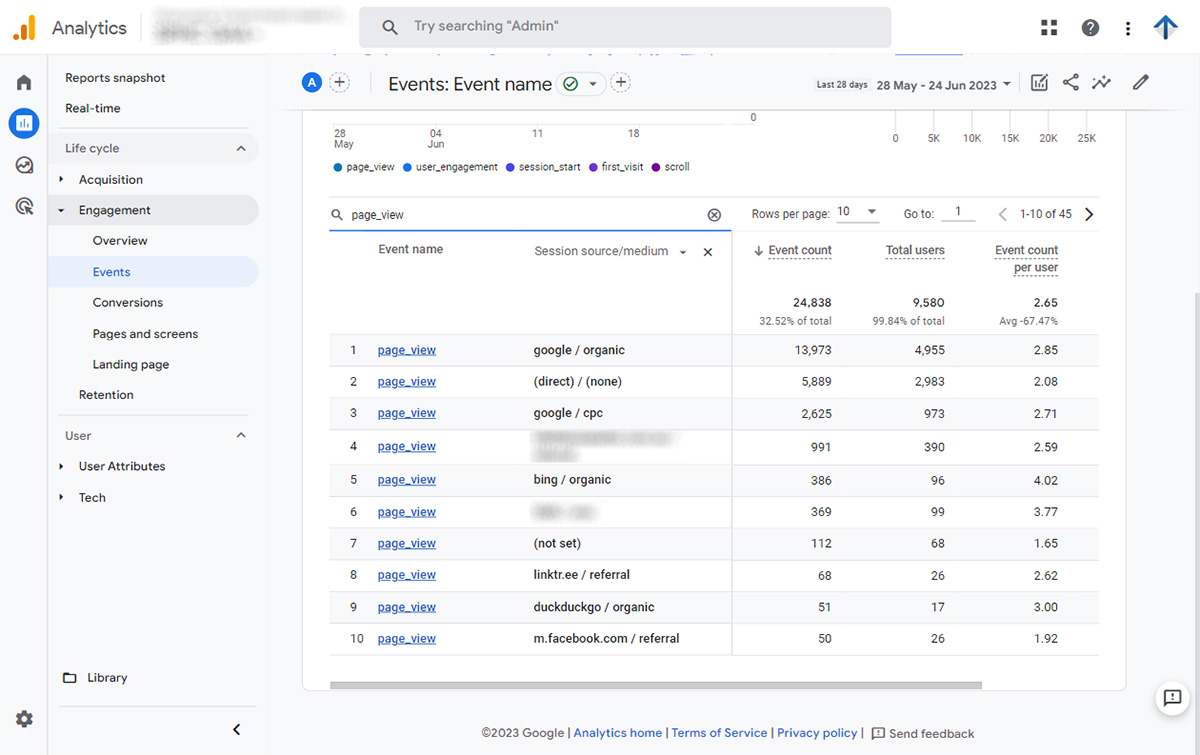
There is way more data being collected in Events than is immediately obvious, so in case you’re worried about where all the details have gone, they may not be gone at all, just not that easy to discover without a little exploring. Let’s look at an example:
The event called “session_start” for example, you might want to see where those sessions came from. Just click on the blue + symbol and search for “Session source / medium”, and select it. A second column of labels will fill the table. Now search within the list for “session_start” by typing that phrase (the search box is above the list) and hit enter. This gives you a list of all the Sources and Mediums for all session starts. You can do that with any Event in the list.
There are many more ways to drill into data, this is just one example to encourage you to explore.
Each event has a selection of Parameters that enhance the details of the event. In other words: a “page_view” event obviously occurred when someone viewed a page, so the “page_location” parameter accompanies each “page_view” event, which is the URL of that page. It can be discovered easily using the blue + icon or can be surfaced into reports using some customisations that are not initially that obvious. We can help.
Start here to read more about GA4 Event Parameters.
Missing data?
There may be situations where you want to look at some finer details but end up in frustration.
It’s possibly not because the data is missing. In many cases where you’ve drilled into data where there are not enough examples to ensure privacy for the users of your website GA4 will not show you the data. If the metric you’re looking at doesn’t pass the minimum threshold to ensure user privacy, the data is not shown at all. However, that data is still counted in larger samples, so you might be able to expand the date range to cover more time and get enough data to pass the privacy threshold and display it in the report.
Here’s more detail about GA4 Data Thresholds.
Menu:
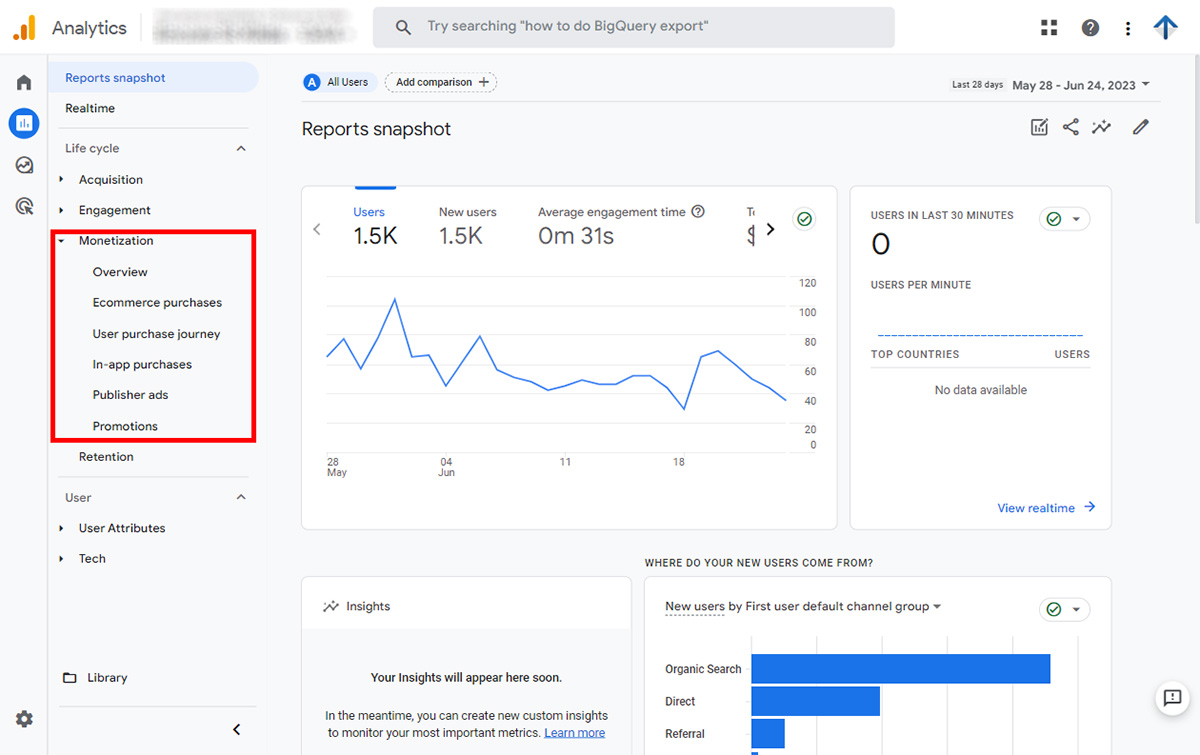
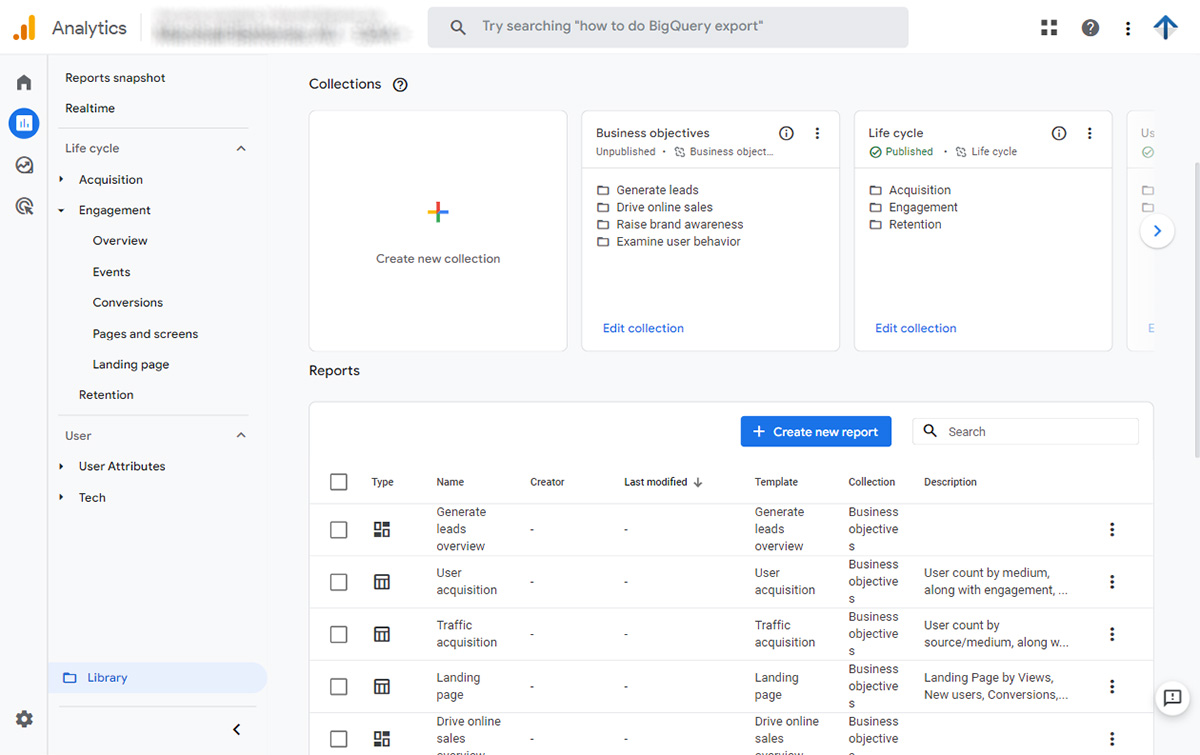
Not all the items in the new GA4 menu may be applicable to your website at all. For example, if you don’t have an eCommerce website (you don’t sell online using a cart process) then the report for Monetization > Ecommerce purchases isn’t applicable to you. You can unclutter the menu to some degree by accessing the Library function and editing the Collections.
You can also customize and add menu items with report pages configured differently, if you want, but only within limits. Again: we can help.
Here’s some reading material for how to manage the GA4 Library:
Explore:
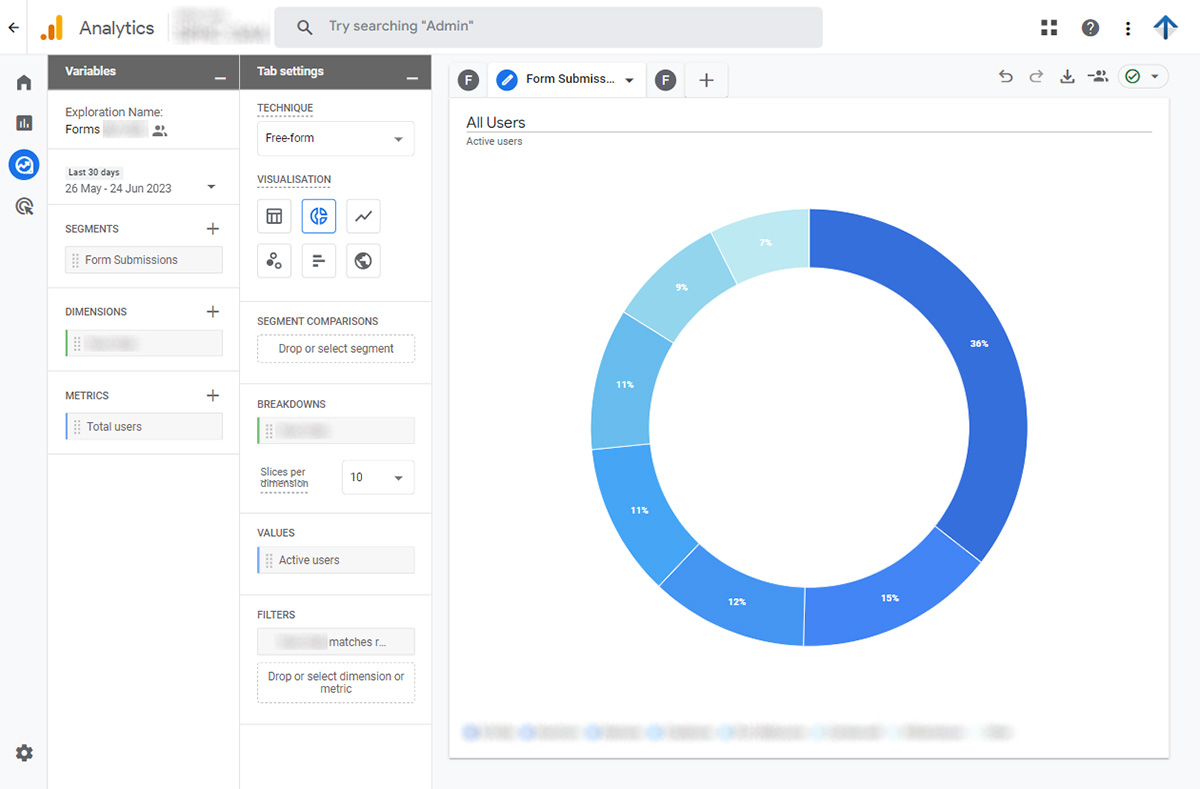
This section is hard to get your head around if you’re not familiar with Segments, Dimensions and Metrics. So perhaps spend some time getting familiar with those concepts first.
Once you’ve figured out those terms a bit, then you can try to tackle your first Exploration report, but even then this is still reasonably complex, so check out the Google help here.
For what it’s worth, we use this infrequently ourselves and prefer to use Looker Studio.
Reporting is an integral part of understanding how to build you business. We specialise in drawing out KPIs and understanding how to deliver market growth. If the growth levers or opportunities in GA4 aren’t that obvious to you, please talk with us to find out how to surface what you need to know.
Reporting:
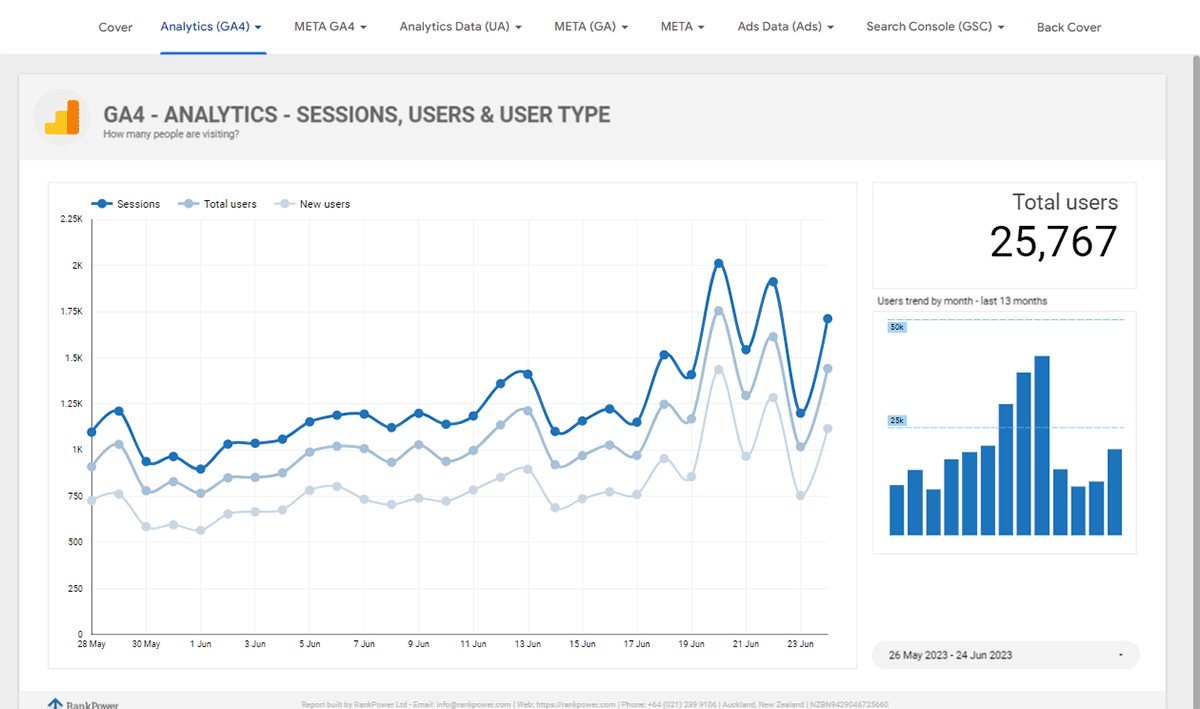
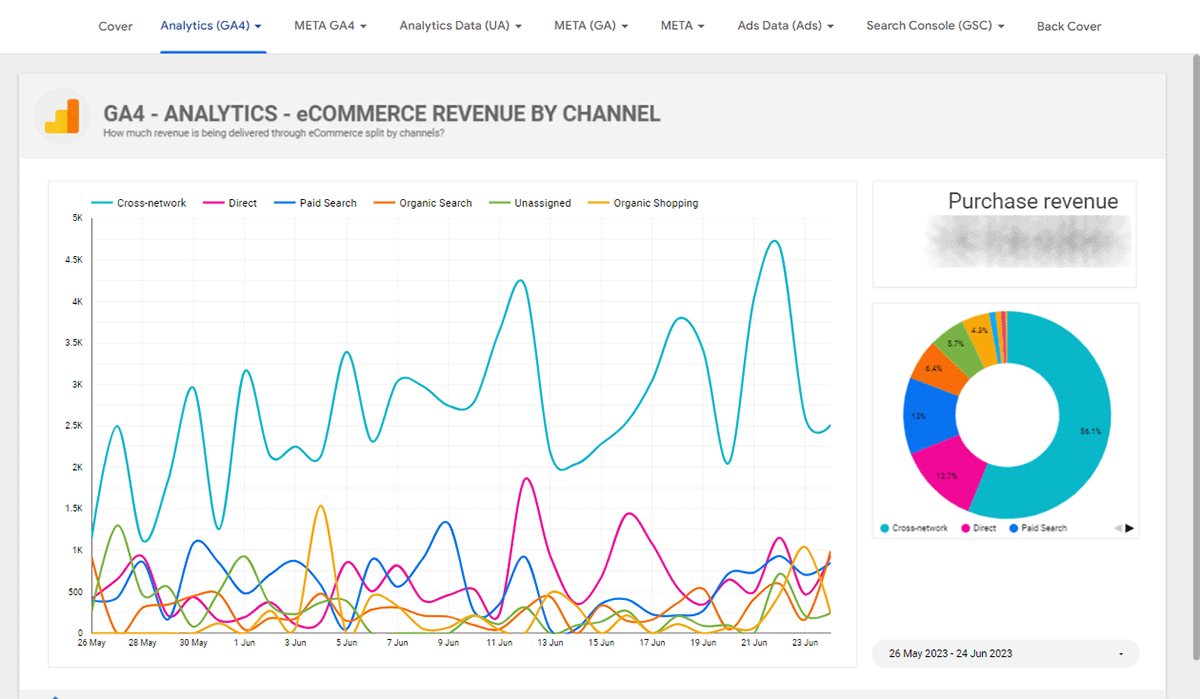
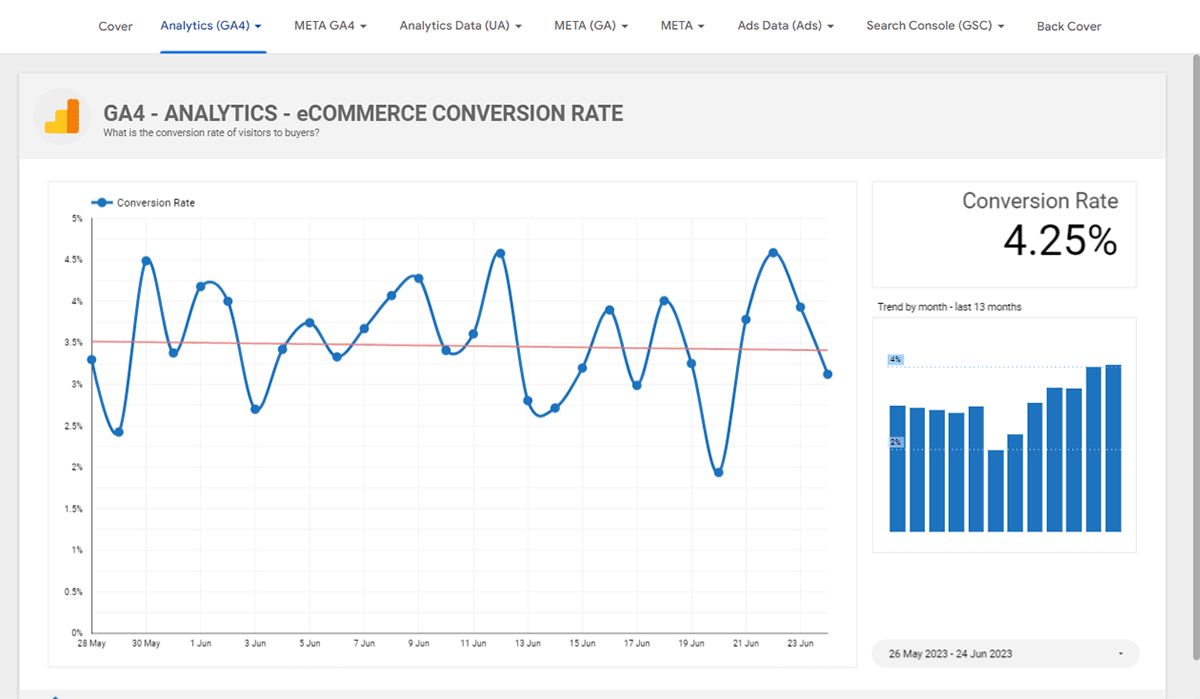
At the end of the day, getting data out of this system for the purpose of reporting to stakeholders can be a little hard if you haven’t spent a lot of time on learning this new platform yet. Generally, we recommend using Looker Studio for all stakeholder reporting because it’s just easier to get a great visual report that can be customised to suit, and you can combine report documents with other sources like your Google Ads, or you SEO efforts and much more.
We recommend Looker Studio in almost every case.
Here are a few screen shots of data we get out of GA4 with Looker Studio.
Haven’t got GA4 Yet?
Act soon to get this set up. You will begin missing out on key data from July 1, 2023.
RankPower are highly experienced in GA4 setup for all degrees of complexity. We live and breath GA4 now and have done for the last 2 years. We’re no strangers to it. So, if you need a new GA4 solution with or without a stakeholder-usable dashboard connected, get in touch and we can help.
Complete this form to get our help with GA4:

