How to Measure Brand Lift: 2 Alternative Methods
Whenever we run brand marketing activities, we are faced with the challenge of understanding how those activities affect online traffic and conversions. There may be no direct way to measure that connection.
Most agencies report their brand marketing in terms of the reach or frequency of showing the ad to the target demographic, but this tells you nothing about the results. You probably want to understand how your investment is paying off in terms of the brand becoming more well-known or desirable, known as brand lift.
In some instances, agencies may connect online activity with brand marketing, for example, through YouTube ads or similar methods, and try to express it as a cost per acquisition (CPA) of winning a conversion from the user who clicked on the ad. However, human nature means that when watching YouTube or reading the news, we tend to engage in what we are there for and not be bothered right now with an ad. We might remember the brand and try to look it up later or recall the brand name when we have an interest in what the brand was offering.
In those cases, we have to rely on existing datasets to see if any patterns emerge that might correlate with brand marketing. If patterns emerge, we could potentially credit the brand marketing with the result.
Solving the Measurement of Brand Lift
Google announced quite some time ago the inclusion of brand lift measurement functionality as part of YouTube ad performance metrics within the Google Ads platform, a function not available to all advertisers.
This functionality is designed to specifically measure the effect on brand awareness resulting from advertising on YouTube, a Google-owned channel.
The purpose of this article is to provide you with an alternative methodology to measure brand lift using data not necessarily associated with any brand awareness campaigns on Google platforms. This methodology allows you to build your brand across other channels and still measure how that might affect brand awareness.
For example, you may wish to use traditional billboard advertising but need to know how your investment may be filtering through to online engagement.
An Example of Brand Lift Measurement: Google’s YouTube Brand Lift Functionality
Available in the Ads platform since 2014.
“Traditionally, brand measurement has played an important role helping brands understand two points in a consumer’s purchase journey. The first was at the start of the purchase journey, measuring how many people in a target audience were reached. Then, at the end of a campaign, you could measure the impact on conversions after the media had run. There has been a big gap in the middle, during those moments when the consumer is searching for information, building interest, considering products, developing opinions, and forming intent. Brands needed a scalable, actionable solution to understand the impact of their advertising on brand perceptions at these moments that matter.”
Google’s YouTube channel, 2014.
How Google’s Brand Lift works
Brand Lift is available for YouTube ads bought via auction.
To use Brand Lift, your would need to create a Product or Brand representing your advertised object. Think of this as a grouping of all your campaigns that share a common denominator. This can be a brand, product, store, service, or anything you wish to advertise. Using the details you provide about your advertised object, Google would assist you in generating a set of survey questions that will be shown to your target audience to measure Brand Lift.
Google would show your Brand Lift surveys on YouTube, before a video starts. These surveys are split across the following groups:
- People who have seen your ads
- People who were eligible to see your ads, but didn’t see them
Multiple surveys could be created for different metrics to be shown to users at different times. The difference in the responses between the group who saw your ads and the group who didn’t would determine the influence your ads had on key brand metrics, such as ad recall, awareness, consideration and more.
There are other examples of Brand Lift measurement available in-market today. We are just calling out this one example.
RankPower’s Alternative Brand Lift Measurement Methods:
The following methods rely on some assumptions:
Assumption 1: When users learn about a brand, they want to find out more about that brand before engaging or buying.
To borrow words from the 2014 Google video:
“…searching for information, building interest, considering products, developing opinions, and forming intent.”
This implies that users may embark on quite a complex journey before they make any decisions about engaging and buying.
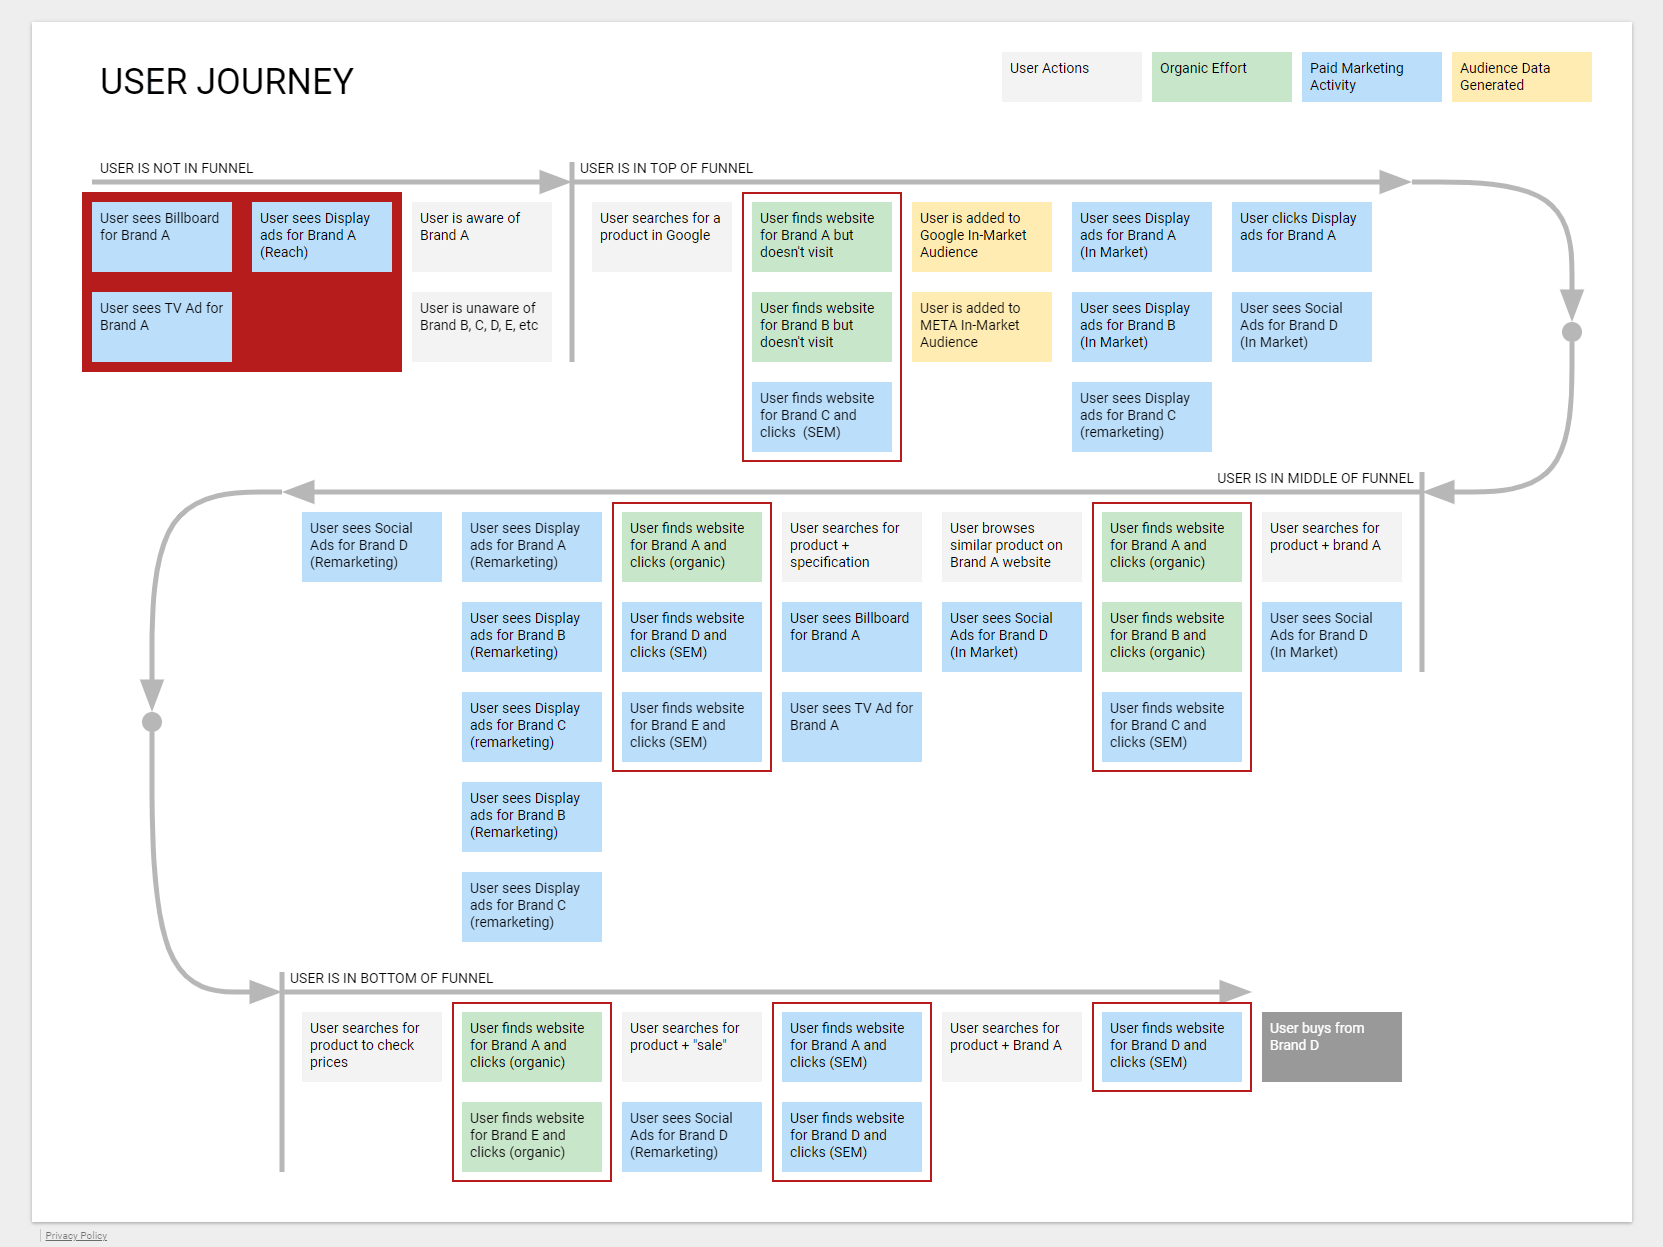
Assumption 2: One of the touchpoints used to gain more information about a brand is Google Search.
The challenge is that we do not know exactly how many, or what percentage of users finding out more about a brand will use Google search.
You may have access to two points of data from Google Search in relation to your brand: Google Search Console and Google Ads. These are the points circled in red in the User Journey schematic above, stemming from the Brand Marketing initiated at top of funnel, marked with the red background in the schematic.
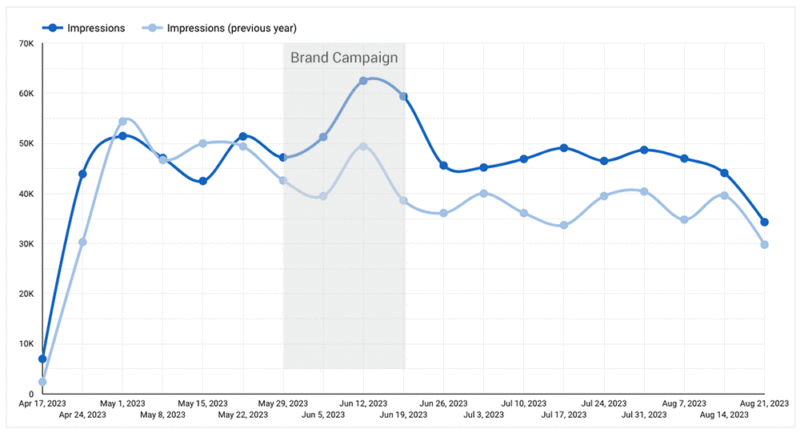
In the RankPower methodologies expressed below, we are trying to determine what effect brand marketing activity from the end of May to mid-June had on brand lift for one of the brands we are working with. The brand activity was delivered by a partner agency.
RankPower Method 1: Organic Search Data from Google Search Console
The first method looks at the rate of occurrence of the brand in organic search.
By examining organic search data of the brand name, it may be possible to find correlations between brand marketing activity and the response to that marketing as it filters through Google Search. You will need to have access to your brand website’s Google Search Console to use this method, which should have been set up in advance. To find out more about GSC, check here and follow instructions on how to set this up if you haven’t done so. GSC will not be able to provide historical data unless previously set up.
Step 1: Set up the basic chart
Using Looker Studio, create a timeline chart of the metric Impressions from the GSC Site dataset (a free connection is available from GSC to Looker Studio – this whole solution is free of cost). Set date granularity to ISO Year Week to eliminate daily variances, otherwise, the chart will look too jagged and hard to read.
Step 2: Filter the data
Filter the report so that it applies only to the brand name*. You may need to experiment with regex expressions to capture the most common ways that users might spell or write your brand in search, but generally, the exact name of your brand should be a good indication of change.
*This won’t work if your brand name is either a common word or is the same as (or very similar to) another brand name. If your brand is also the same as a brand in another country, be sure to follow Step 3.
Step 3: Eliminate unwanted data
Filter out countries where your brand marketing is not active. This helps eliminate anomalies that are not relevant from being added to the resulting data. You might need to examine GSC data closely to understand how to focus on only the searches that are relevant.
Step 4: Set the date range for the timeline being examined
In the Date Range function for the chart, set the date range that you want to compare and add the comparison range, e.g. the last period, the last year, etc. OR simply set the date range to cover the timeline before your brand marketing activity and include the date at which it began.
Step 5: Correlate the data
Examine the timeline chart for any changes in the Impressions metric that could correlate to your brand activity. Remember: the brand activity doesn’t have to have been on any Google platform – you are examining how people might have turned to Google Search to find out more about your brand during the time in which they were exposed to it.
RankPower Method 2: Paid Search Data from Google Ads Brand Campaigns
The second method looks at the rate of occurrence of the brand in paid search.
By examining paid search data of the brand name, it may be possible to find correlations between brand marketing activity and the response to that marketing as it filters through Google Search. You will need to have a brand-focused keyword campaign active in Google Ads, using exact-match keywords only so that the campaign only triggers ads when the exact brand name is searched.
If you don’t have a Google Ads campaign running like this, you will need to set one up here. You will not be able to get this data without paying for ads.
Step 1: Set up the basic chart
Using Looker Studio, create a timeline chart of the metric Search Impr. Share from the Google Ads data source. Lock the Y-axis to a minimum of 0 and a maximum of 1.
If your Search Impr. Share for your Brand Campaign dips below 10%, you cannot use this methodology during those times when it fell below. The greatest accuracy in this methodology is achieved when the Search Impr. Share consistently falls above 50%. This means you have to invest in your brand ads to protect your brand from competitor activity, so there is a benefit in doing so anyway.
Step 2: Filter the data
Filter the report so that it applies only to the Brand Campaign.
Step 3: Set the date range for the timeline being examined
In the Date Range function for the chart, set the date range that you want to compare and add the comparison range, e.g. the last period, the last year, etc. OR simply set the date range to cover the timeline before your brand marketing activity and include the date at which it began.
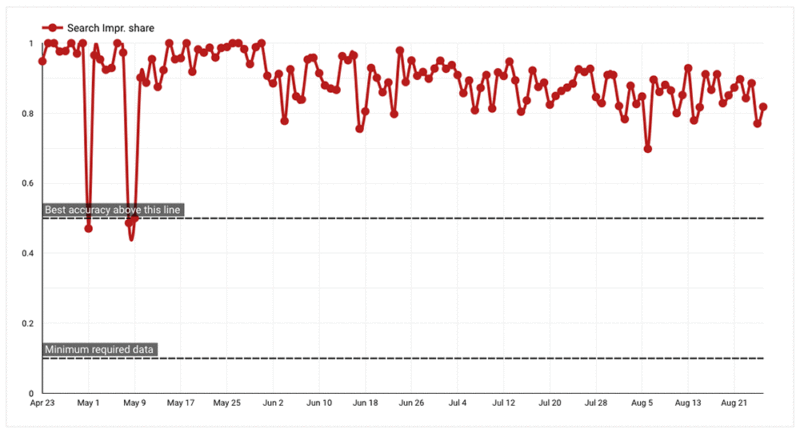
Step 4: Create the Market demand chart
Now duplicate the chart using the same timeline and campaign filter settings, but this time use a calculated metric:
[Impressions] / [Search Impr. Share]
Unlock the Y-axis (automatic max) and change the date granularity to ISO Year Week.
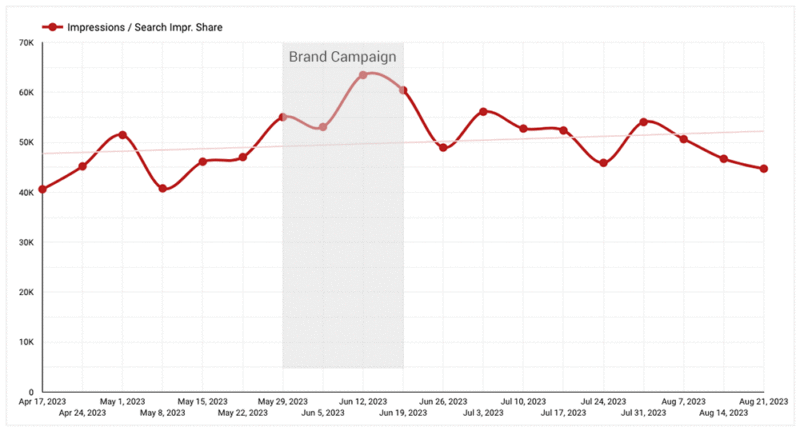
The resulting chart is a projection. It assumes that your Brand Ads Campaign was operating uninterrupted and made a reasonable effort to protect your brand in search.
In the example, the chart suggests a boost in brand lift from the end of May through mid-June. A rising trendline also suggests that the activity may have been beneficial longer term.
Step 5 (optional): Validity Check
Because we have relied on a calculated metric in the second example, it’s not a bad idea to perform a comparison and run both methods side by side.
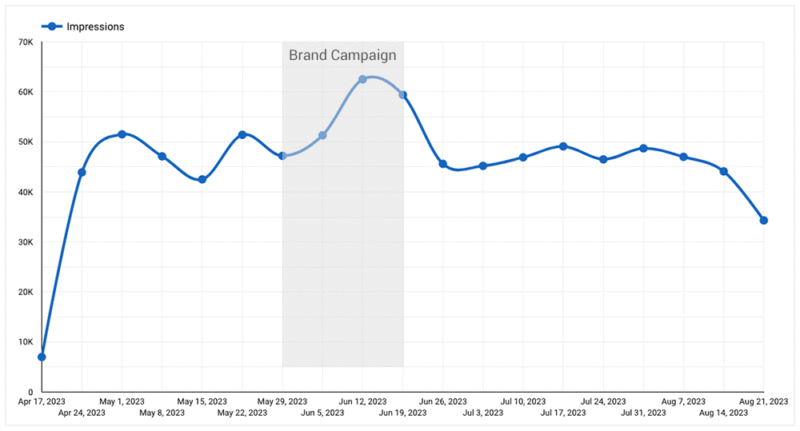
Here we can see a reasonable correlation between the organic search data and the calculated metric from paid search. From this, we could assume that the calculated metric is sound and the observation is valid.

Data from Paid Search
Corresponding data from Organic Search
Similarity between Paid and Organic data would seem to validate the assumption that the calculated Paid data (Impressions / Search Impr Share) could be used as a reliable indicator.
Step 6 (optional): Advanced Analysis
An area of advanced analysis is also possible:
Using Google Analytics GA4 and applying a First User Acquisition model, it may be possible to understand how many new users are being referred to the website via brand searches from paid search. If a brand search plays a key part in acquiring more users and customers, you may also be able to correlate that real-world gain to your business bottom line, because you will be able to discover how many sales are indirectly attributed back to the acquisition of that user.
Organic search increases for brand searches have a flow-on effect on the overall relevance of the website in all organic searches. In other words, your brand marketing activity (in any medium) can have a positive effect on your website’s SEO position.
Conclusion:
While we can’t use the above methods to answer the question of how we affected brand perception, we can use them to get a gauge on how much overall interest may have been generated and how that interest is filtering through to the brand website.
User journeys are very complex. In many cases, you can take advantage of the brand search touchpoints to understand how brand awareness is changing over time.
